
August 14, 2025
Security and transparency sit at the core of Datoshi, Your AI Data Buddy. Built in direct response to user requests, the new Activity Log brings those principles to life by recording every request and response in your workspace so you can verify who did what, when, and how.
Security by design
Datoshi has always taken a defence-in-depth approach to safeguarding your data.
Local dataset storage – CSV and Excel files stay in your browser, inside an OPFS‑backed SQLite database that is isolated by strict Cross‑Origin‑Opener‑Policy and Cross‑Origin‑Embedder‑Policy headers. Your raw data never travels to any place, including our servers.
Encrypted connection configs – External database configs are encrypted at rest and in transit. Queries run through short‑lived, TLS‑protected channels only when you request them.
No data retention by cloud LLMs – We have configured provider endpoints so that prompts and completions are not stored by the model vendor. For extra assurance, Team and Enterprise customers can deploy fully private LLMs on‑prem or in their own cloud.
Coming soon: Data Anonymizer – A zero‑setup masker that obfuscates sensitive columns before any cloud processing, letting you keep privacy intact while still benefiting from powerful hosted models.
Because we already have these controls, the Activity Log can show you a complete and trustworthy picture without compromising privacy.
Why Activity Log matters
Audit and compliance – Instantly confirm which user ran queries, uploaded a file, or changed a connection.
Security monitoring – Detect unusual requests or failed connection attempts before they become incidents.
Team collaboration – Follow a chronological story of your team’s work. Hand‑offs are effortless.
Performance insight – Spot slow or repeated operations that need optimisation.
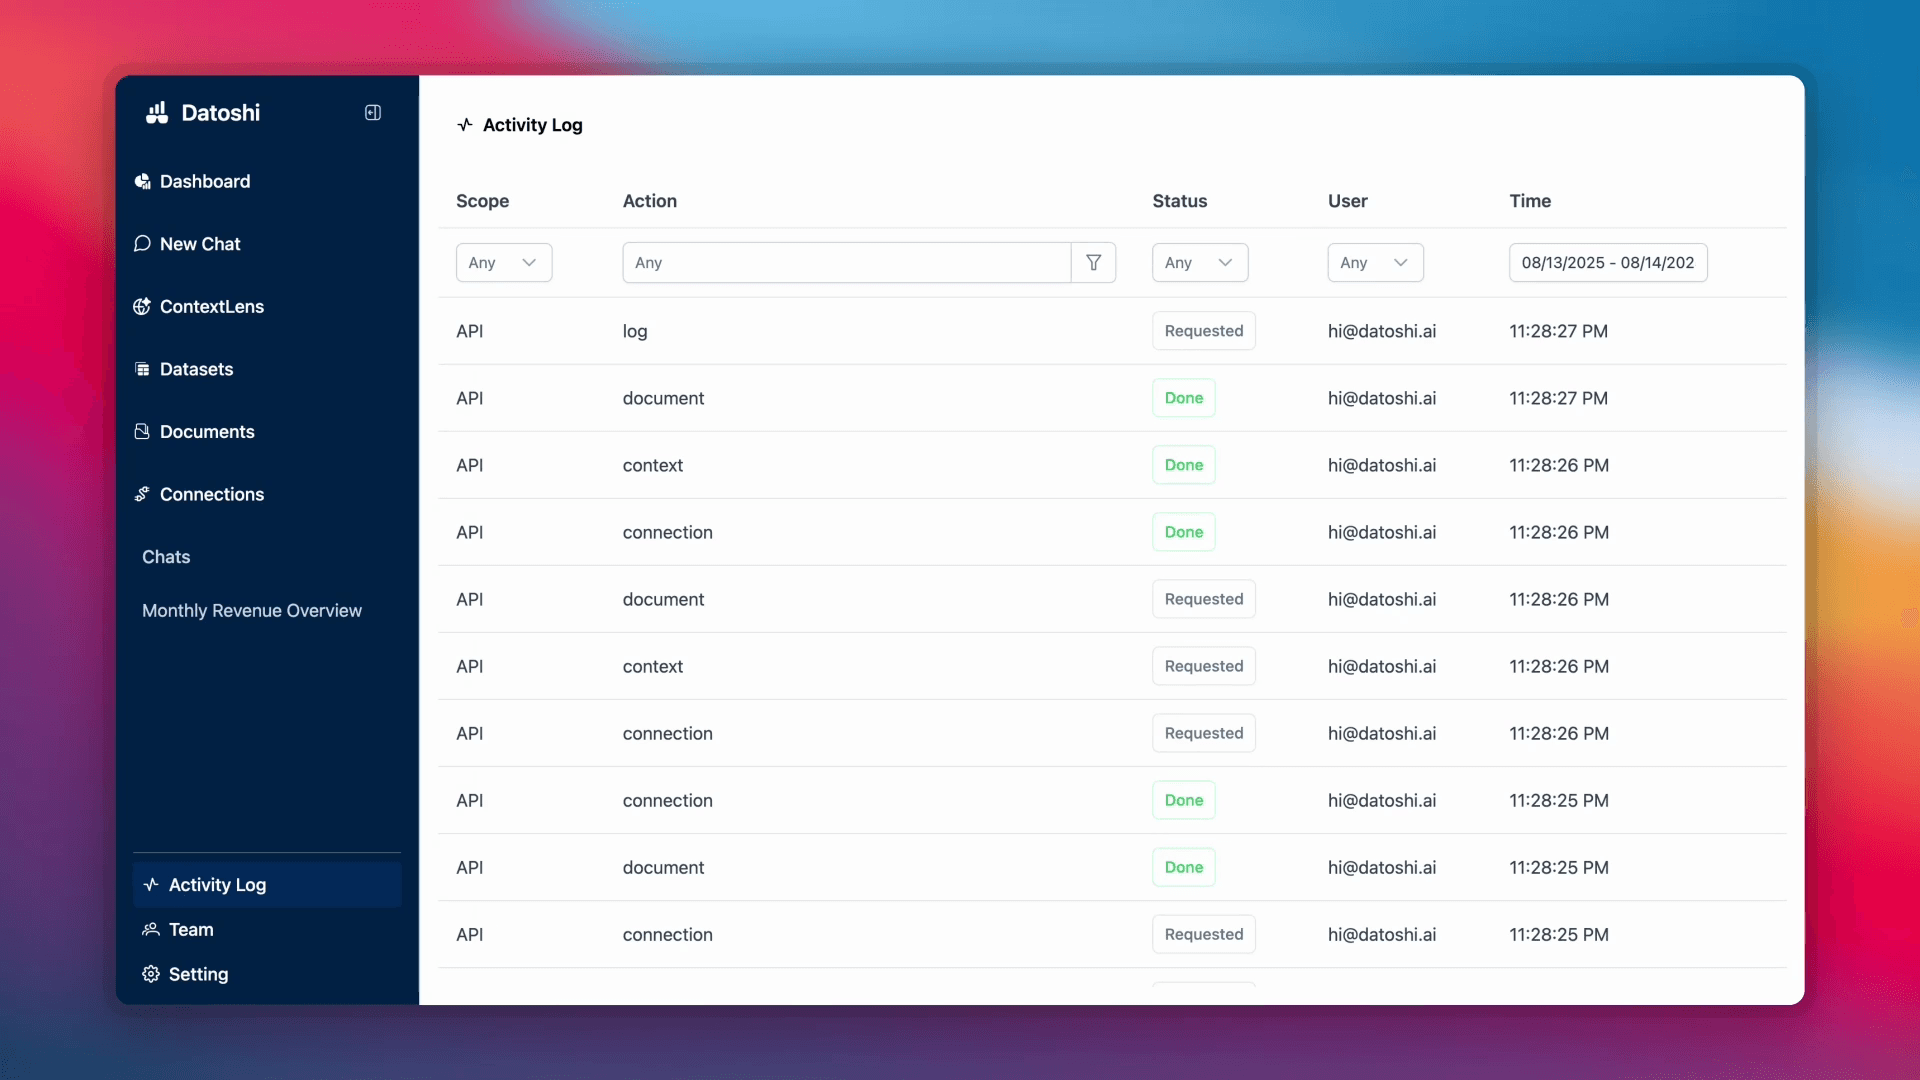
What you can see
Scope: Layer affected: API, Connections, …
Action: The exact operation, such as document upload or connection test
Status: Live progress labels (Requested, Done, Failed) so you always know where things stand
User: The email of the teammate hat triggered the action
Time: Precise timestamp in your local timezone
Powerful filters at the top let you slice the log by any combination of scope, action, status, user, and date range, then bookmark favourite views.
How to use Activity Log
Open Datoshi and select Activity Log in the left navigation.
Adjust the filters to focus on the events you need.
Click any row to expand technical details, including full API payloads for connections and the exact SQL text sent to your databases.
Export to CSV if you want an off‑platform archive (available for Team and Enterprise plans).
Availability
Premium – View‑only access to the last 7 days.
Team – 90‑day history plus CSV export.
Enterprise – Custom retention, on‑prem or private‑cloud storage, and webhook alerts.
Reach out to hi@datoshi.ai if you need longer retention or SIEM integration